
As use cases are defined bottom up, they identified very diverse Key Performance Indicators (see Table 2 below), highlighting the need for aligning them in a common impact framework. This will be established in the inception phase of the project, leading up to the first project milestone. It will include a methodology to estimate or measure baseline performance, against which performance on the project results can be plotted, and that can be used to establish the baseline in the first year of the project. As not all KPI’s will be suited for quantitative measurement, a mixed method approach, including a mix of quantitative and qualitative methods will be implemented. Moreover, the work will need to examine economic approaches, e.g. to determine cost structure of processes, differentiate its elements and identify ways to objectively calculate or survey economic effects of NIVA innovations. It is expected that this Impact Framework will need to be updated and improved during the running time of NIVA.
Table 1 Uce Cases of NIVA, presentations and visualizations
Use Cases | Presentations | Visualizations |
UC1A – Earth Observation Monitoring and Traffic Lights | ||
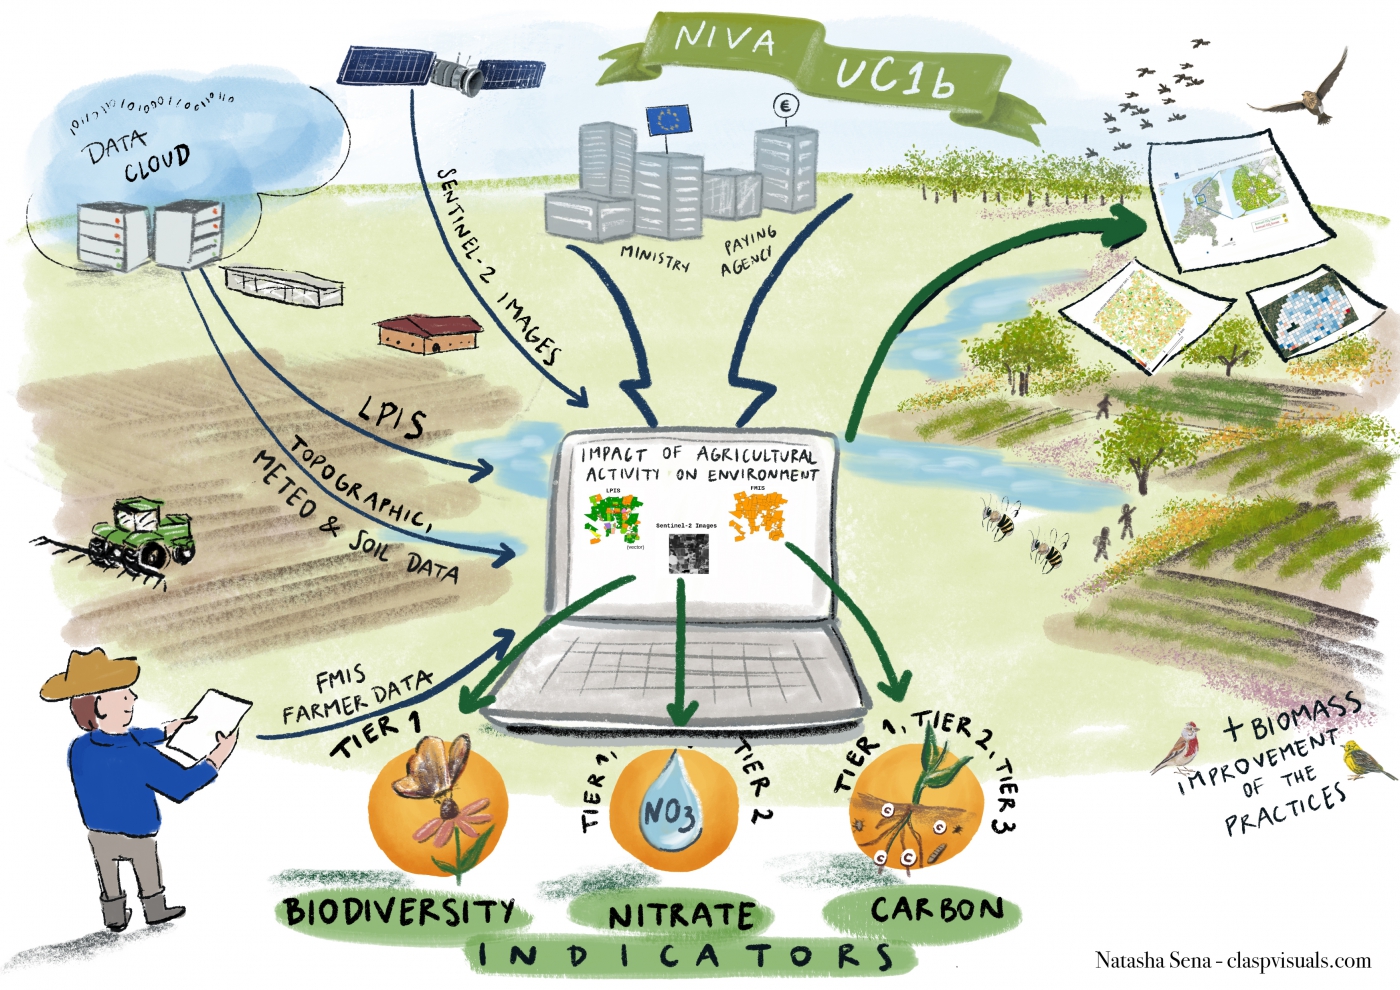
UC1B – Agro-environmental monitoring | ||
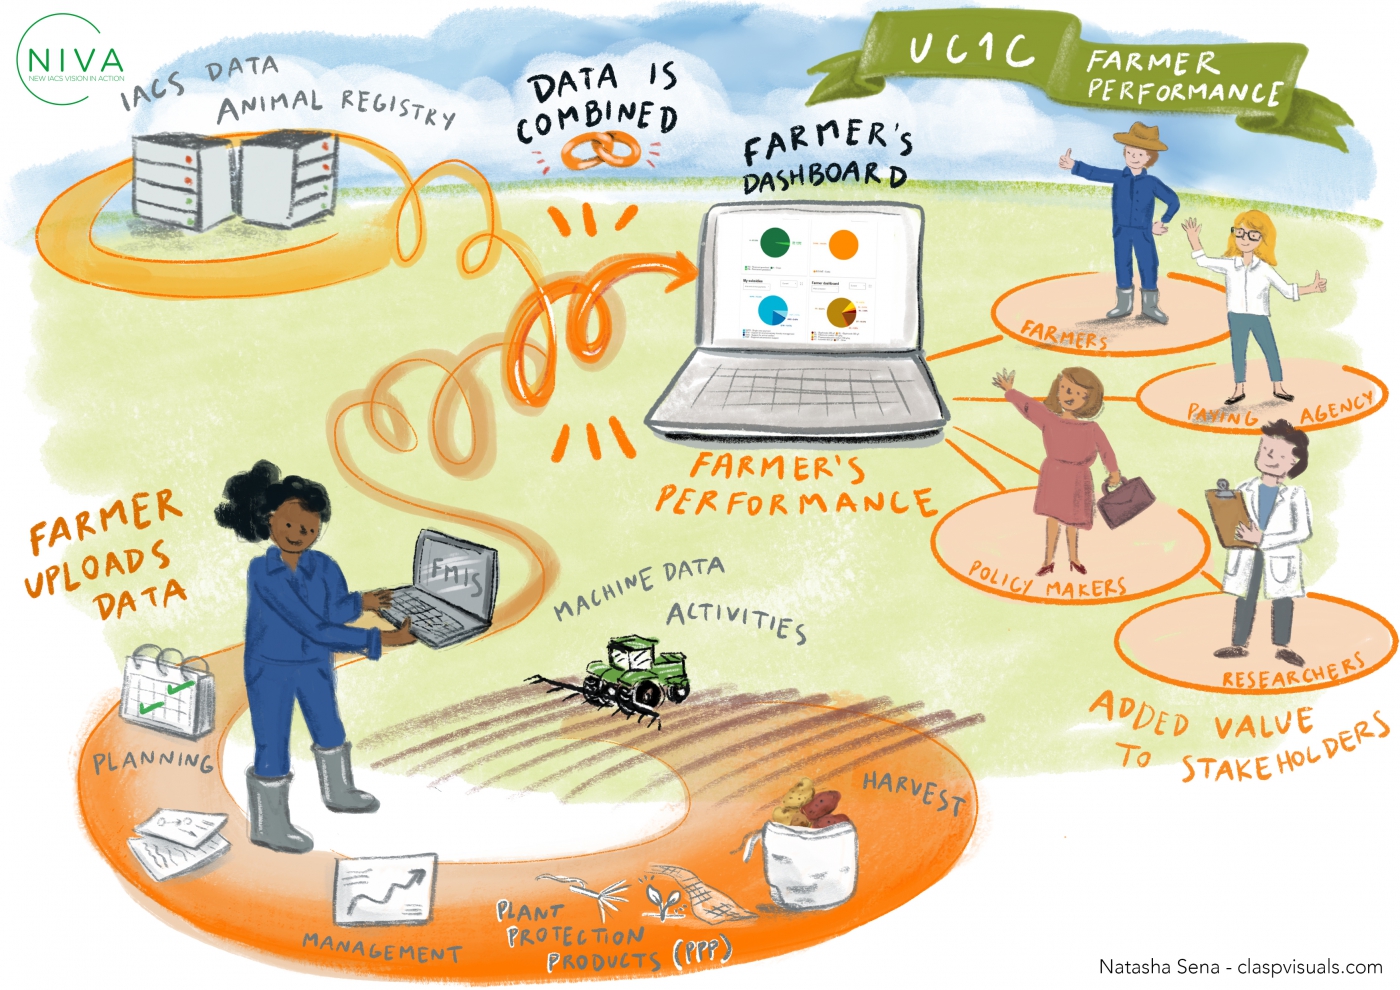
UC1C – Farmer Performance | ||
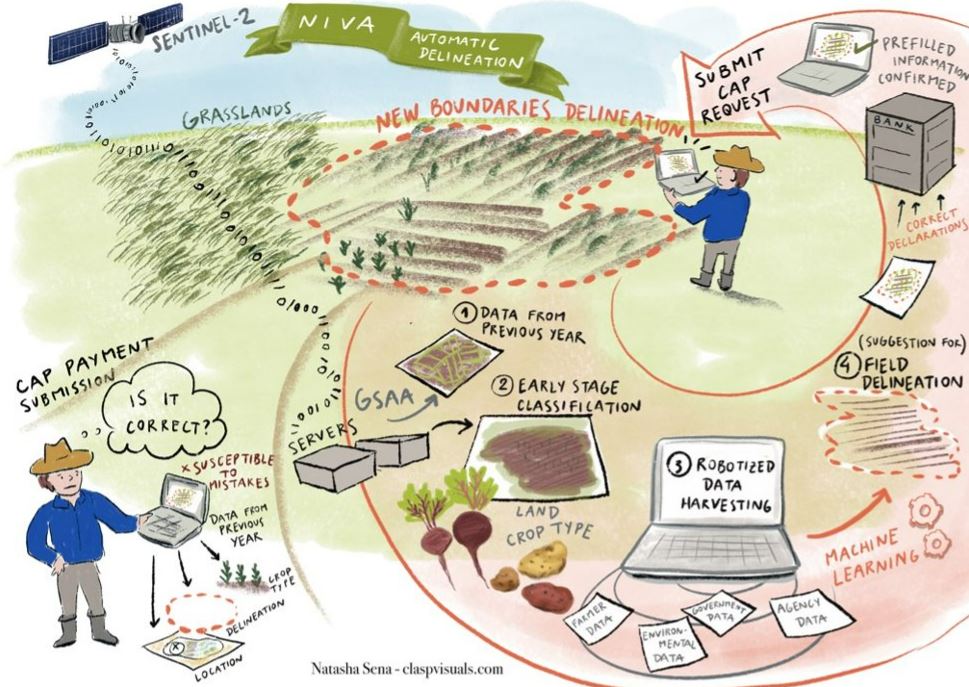
UC2 – Prefilled application, GSAA/Land link | ||
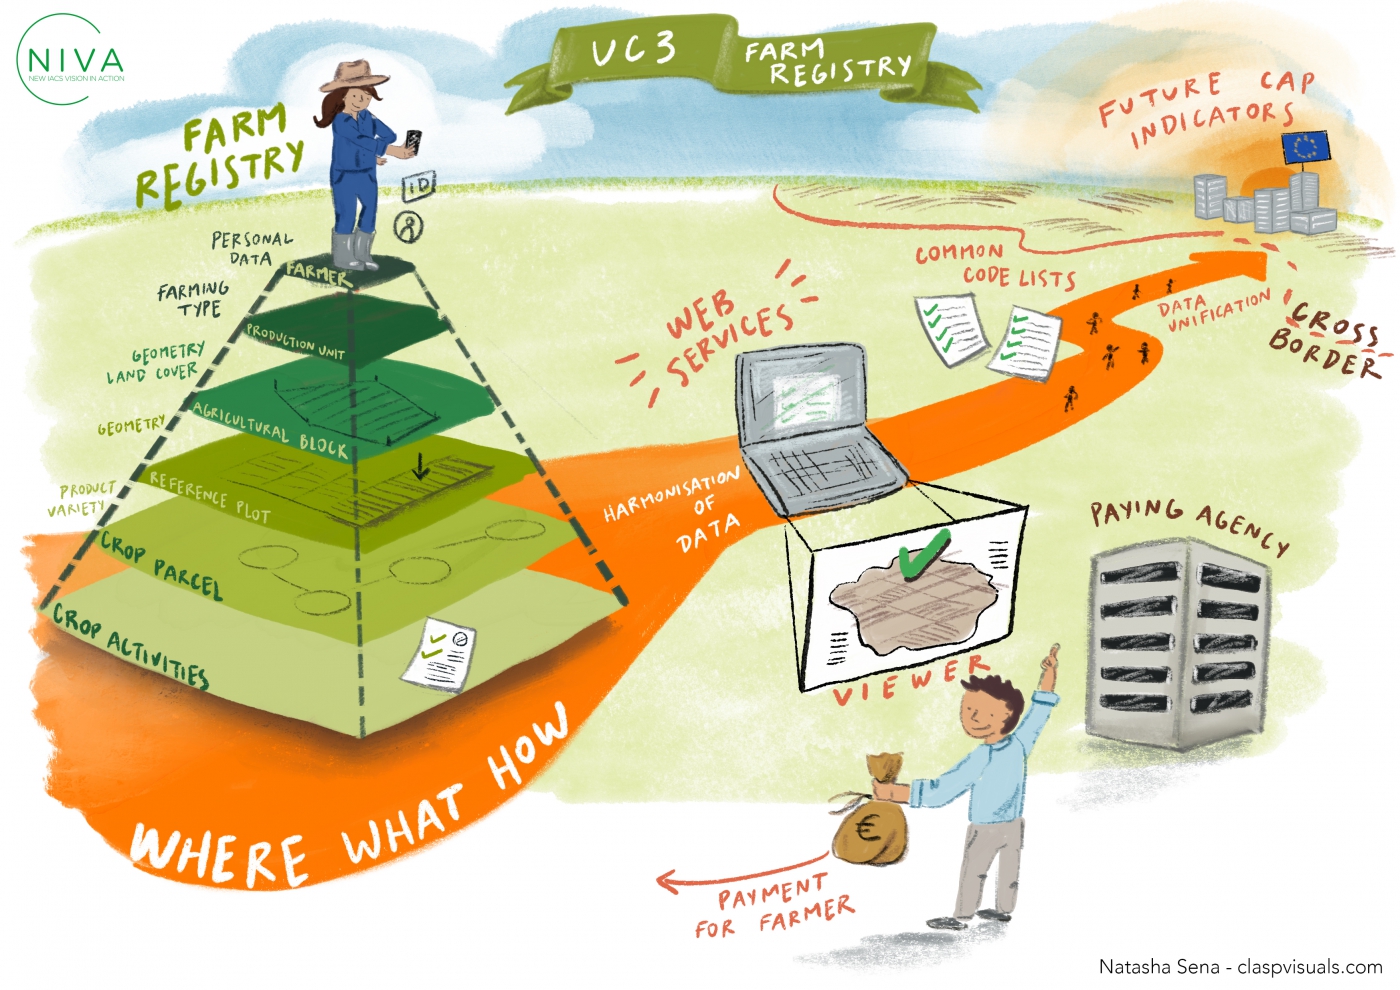
UC3 – Farm Registry | ||
UC4A – Geotagged photos | ||
UC4B – Machine data in GSAA as added value data | ||
UC5A – LPIS: Update & Change detection | ||
KPI’s Conclusions
In this section, it will be provided a general analysis of the KPIs information provided in the internal surveys by the different partners and UCs.

Paying attention to the performance indicators, with respect to the surface indicators, the use cases, in cases they have such indicators, respond affirmatively that these have been successfully achieved.
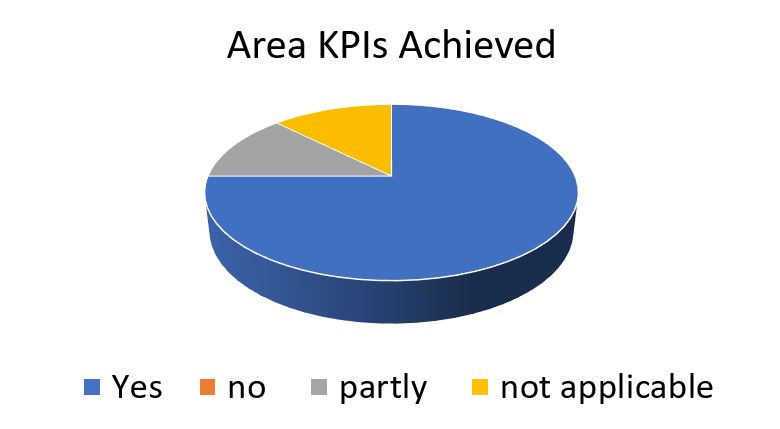 NIVA Area KPIs
In fact, the data samples have been really significant, applying in most cases to entire countries or to very significant areas:

NIVA Samples surface
Regarding other evaluation KPIs, we can comment that the use cases claim to have generally achieved the indicators related to the relevance of the tools:
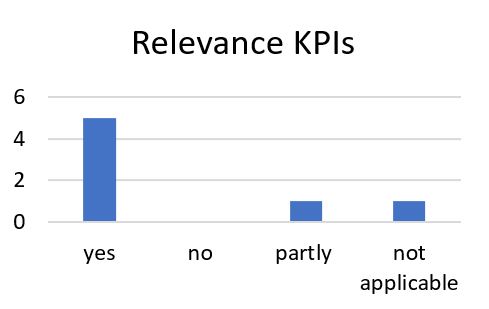
NIVA Relevance KPIs achievement
Perhaps more relevant is the analysis of the user indicators, where the Use Cases have been mostly able to achieve them:
 NIVA Users KPIs achievement
Nevertheless, what are these deployment users like? As can be seen in the following graph, these are located mainly in the PAs, however more than 25% are actual farmers and end users. In addition, there is another 25% of other users who can be classified as IT developers and academic fields, among others.
 NIVA deployment users
We also highlight how all the use cases, expect one, mention that the users worked on the deployment tests under “In real life conditions”. When asked if the tools developed were evaluated in the terms of their quality and if this was sufficient for their actual operation, the data obtained is, in both cases, as remarkable 84%:that is, NIVA has successfully managed to develop tools of good quality. They are also quality enough and easily usable in NIVA PAs, in other European countries and outside the European Union. The final outcomes of the KPI monitoring and benchmarking show that NIVA has been altogether on the right track.
For more information: D2.6 – Monitoring and Benchmarking